

What are stock valuation metrics and why do they matter?
Stock valuation metrics are financial ratios and measures investors use to determine whether a stock is fairly priced, undervalued, or overvalued compared to its earnings, assets, cash flow, or growth potential.
If you have ever asked, “Is this stock expensive or cheap?” valuation metrics are the tools that help you answer that question with data instead of emotion.
Many investors focus only on price. That is a mistake. A stock trading at $20 can be more expensive than one trading at $500. What matters is the value you are getting for the price you pay.
This guide explains stock valuation basics in a clear and practical way. We start with the most popular metric, the P/E ratio, then move beyond it to other valuation ratios professionals use. You will learn when each metric works, when it fails, and how to combine them for better decisions.
What problem do investors face when valuing stocks?
Problem: Most investors rely on a single valuation metric, usually the P/E ratio, and assume it tells the full story.
This creates three common issues:
- Overpaying for fast-growing stocks without understanding risk
- Avoiding “cheap” stocks that are cheap for valid reasons
- Comparing companies across industries using the wrong benchmarks
For example, a P/E ratio of 30 might look expensive. But for a fast-growing software company, it could be reasonable. That same P/E would be risky for a utility company with slow growth.
Agitation: When investors misuse valuation ratios, they make emotional decisions, chase hype, or panic during market drops.
Solution: Learn how different stock valuation metrics work together. Each ratio answers a specific question. No single metric is enough on its own.
What is the P/E ratio and how does it work?
Short answer: The P/E ratio compares a company’s stock price to its earnings per share (EPS).
Formula:
P/E Ratio = Share Price ÷ Earnings Per Share
If a stock trades at $100 and earns $5 per share, its P/E ratio is 20.
This means investors are willing to pay $20 for every $1 of earnings.
Why the P/E ratio is so popular
- Easy to calculate
- Easy to compare within the same industry
- Widely available on all financial platforms
Because of its simplicity, the P/E ratio is often the first valuation metric investors learn.
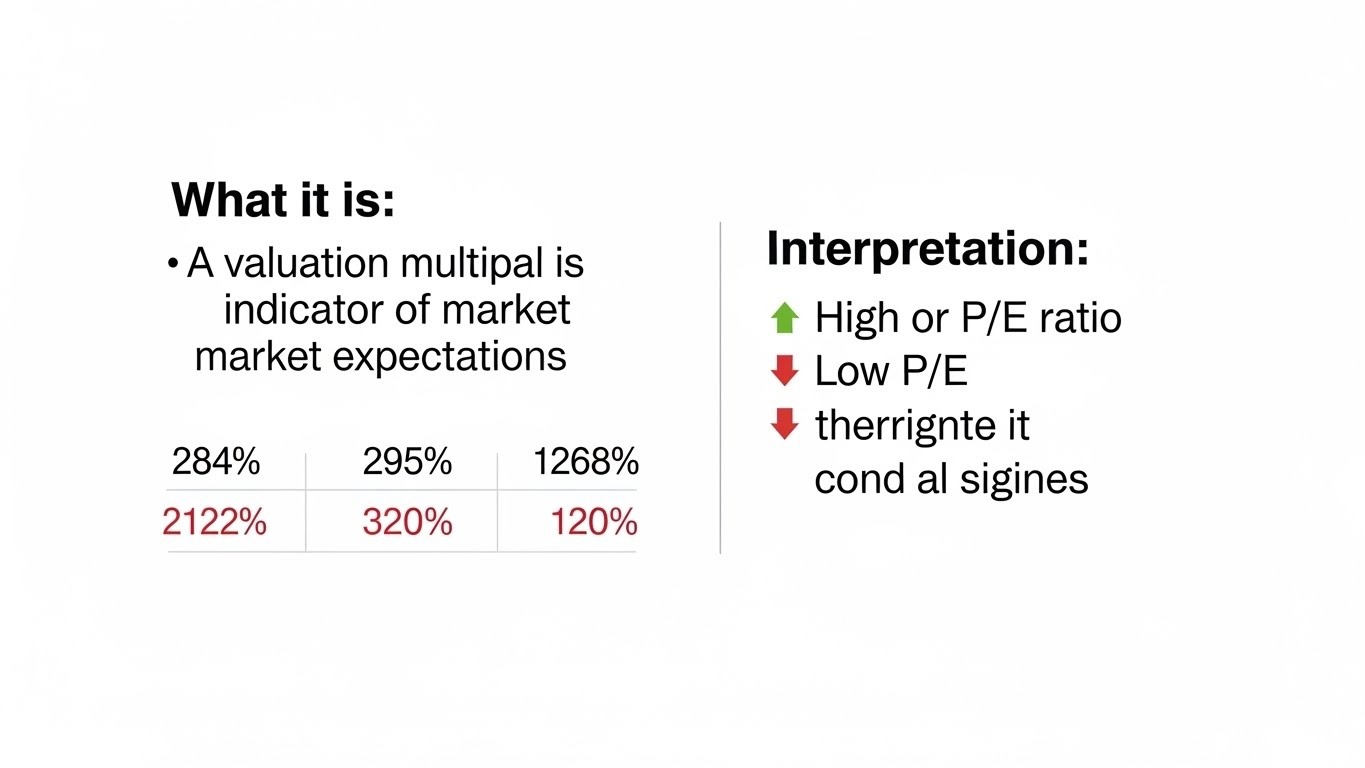
What the P/E ratio does well
- Highlights market expectations
- Works well for stable, profitable companies
- Useful for sector-level comparisons
Case insight: During long-term market studies, broad indices like the S&P 500 have historically traded around an average P/E of 15–20, depending on interest rates and economic conditions.
What are the limitations of the P/E ratio?
Short answer: The P/E ratio ignores growth, debt, and cash flow.
Here are the main drawbacks:
- No earnings: Companies with negative earnings have no meaningful P/E
- Accounting impact: Earnings can be adjusted or distorted
- Growth blind: High-growth firms naturally have higher P/E ratios
- Debt ignored: Two companies with the same P/E can have very different risk profiles
This is why professional investors rarely rely on P/E alone. They use other valuation ratios to fill the gaps.
What is the PEG ratio and when should you use it?
Short answer: The PEG ratio adjusts the P/E ratio for growth.
Formula:
PEG Ratio = P/E Ratio ÷ Earnings Growth Rate
If a stock has a P/E of 30 and expected earnings growth of 15%, its PEG ratio is 2.
How to interpret the PEG ratio
- PEG below 1: Potentially undervalued
- PEG around 1: Fairly valued
- PEG above 2: Growth may be overpriced
The PEG ratio is especially useful for growth stocks. It explains why two companies with the same P/E can have very different valuations.
However, PEG relies on growth estimates, which can be wrong. Use it as a guide, not a guarantee.
What is the Price-to-Book (P/B) ratio?
Short answer: The P/B ratio compares market value to a company’s net assets.
Formula:
P/B Ratio = Market Price ÷ Book Value per Share
When the P/B ratio works best
- Banks and financial institutions
- Manufacturing and asset-heavy businesses
- Value investing strategies
A P/B ratio below 1 may suggest the stock is trading below its asset value. But this is not always a bargain. It could also signal poor returns or weak management.
P/B ratios are less useful for technology or service companies where intangible assets dominate.
What is the Price-to-Sales (P/S) ratio?
Short answer: The P/S ratio compares stock price to revenue.
Formula:
P/S Ratio = Market Capitalization ÷ Total Revenue
Why investors use the P/S ratio
- Works even when earnings are negative
- Harder to manipulate than earnings
- Useful for early-stage or cyclical companies
A low P/S ratio can signal undervaluation, but only if the company has a clear path to profitability.
Revenue without margins is not value.
What is EV/EBITDA and why do professionals prefer it?
Short answer: EV/EBITDA measures company value including debt.
Formula:
Enterprise Value ÷ EBITDA
Enterprise Value includes:
- Market capitalization
- Total debt
- Cash and equivalents
Why EV/EBITDA is powerful
- Accounts for capital structure
- Better for comparing companies with different debt levels
- Common in mergers and acquisitions
This metric is widely used by analysts because it gives a clearer picture of operational value.
What is Free Cash Flow (FCF) yield?
Short answer: FCF yield shows how much cash a company generates relative to its price.
Formula:
FCF Yield = Free Cash Flow ÷ Market Capitalization
Why FCF matters
- Cash pays dividends
- Cash reduces debt
- Cash funds growth
Companies with strong free cash flow are often more resilient during economic downturns.
How should investors compare valuation metrics across industries?
Short answer: Always compare valuation ratios within the same sector.
Different industries have different economics:
| Sector | Common Valuation Metric |
|---|---|
| Technology | P/E, PEG, P/S |
| Banking | P/B, ROE |
| Utilities | P/E, Dividend Yield |
| Manufacturing | EV/EBITDA |
Cross-sector comparisons without adjustment lead to wrong conclusions.
How do professional investors combine valuation ratios?
Short answer: They use a layered approach.
A practical framework:
- Start with P/E or EV/EBITDA
- Check growth using PEG
- Confirm asset value with P/B
- Validate cash generation with FCF yield
This reduces the risk of relying on a single number.
Conclusion: How should you use stock valuation metrics?
Stock valuation metrics are not prediction tools. They are decision tools.
The P/E ratio is a good starting point, but it is not enough. Investors who succeed over the long term understand valuation ratios in context.
Use the right metric for the right business. Compare within sectors. Focus on cash flow, growth, and risk together.
Call to Action: If you want to make smarter investment decisions, start tracking at least three valuation metrics before buying any stock. Bookmark this guide and apply it to your next analysis.
Frequently Asked Questions (FAQs)
What are the most important stock valuation metrics?
The most important stock valuation metrics include the P/E ratio, PEG ratio, P/B ratio, P/S ratio, EV/EBITDA, and free cash flow yield.
Is a low P/E ratio always good?
No. A low P/E ratio can signal undervaluation or reflect poor growth, high risk, or declining earnings.
Which valuation ratio is best for growth stocks?
The PEG ratio is commonly used for growth stocks because it adjusts valuation for earnings growth.
Can valuation metrics predict stock prices?
No. Valuation metrics help assess risk and value but cannot predict short-term price movements.
Why do valuation ratios differ by industry?
Different industries have different growth rates, capital needs, and profit margins, which affect valuation ratios.
Should beginners focus on one valuation metric?
Beginners should start with the P/E ratio but gradually learn additional metrics to gain a fuller picture.
Related Topics: 15 No-Spend Month Rules to Transform Your Financial Habits
Related Topics: The True Cost of Hiring a CPA for Your Small Business




Leave a Reply